You can create a Monitoring MetricSet with a custom dimension to filter and aggregate the metrics that Splunk RUM creates by default. Your custom dimension can be a span tag you've already indexed or a process such as branch or userid. This enables you to:
-
Use your Monitoring MetricSet in charts, dashboards, and alerts.
-
Export your Monitoring MetricSet to Splunk Cloud.
-
Retain your Monitoring MetricSet for 13 months (in contrast to the 8 day retention time for Troubleshooting MetricSets).
- Navigate to the MetricSets configuration page through either of these paths:
-
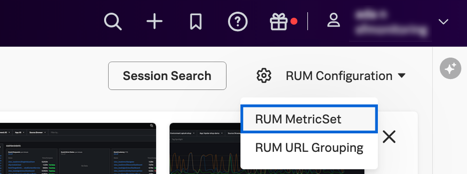
Select Digital Experience and then in the Real user monitoring section select Overview. On the Overview page, select as seen in the following screenshot.

-
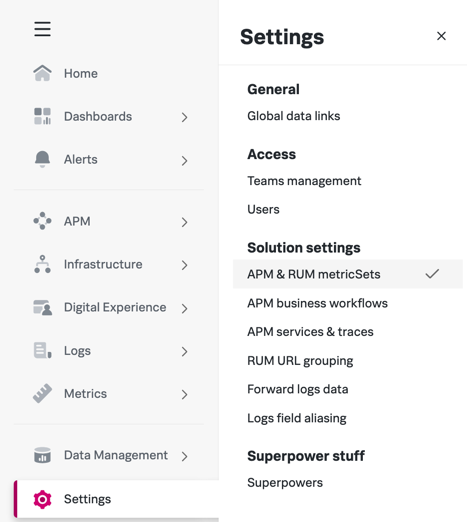
From the left navigation menu, select

- Select Add MetricSet.
- In the Create a new RUM MetricSet dialog:
- Select a scope: You can limit this MetricSet to an application type (Browser or Mobile) and a specific application.
- Select a tag name.
- In the Create MMS section, set the slider to Create Monitoring MetricSet (MMS), specify a target entity to aggregate values for, and optionally, one or more tag values.
- Select Analyze.
- On the Analyze MetricSet Cardinality dialog box, understand how Splunk RUM analyzes cardinality, and select Continue.
Splunk RUM's cardinality analysis predicts the potential license impact of adding this tag, based on 100 data points, one minute apart, from the last 8 days. If the cardinality is too high, consider canceling the indexing of this tag. Avoid indexing unnecessary tags to prevent exceeding MMS entitlements and to reduce overhead. To streamline cardinality management, you should periodically review and clean up any tags you no longer want or use.

- If you accept the cardinality analysis, select Save. Otherwise, select Edit and revise the scope of the MetricSet.
To see your updated dashboards, navigate to Dashboards.