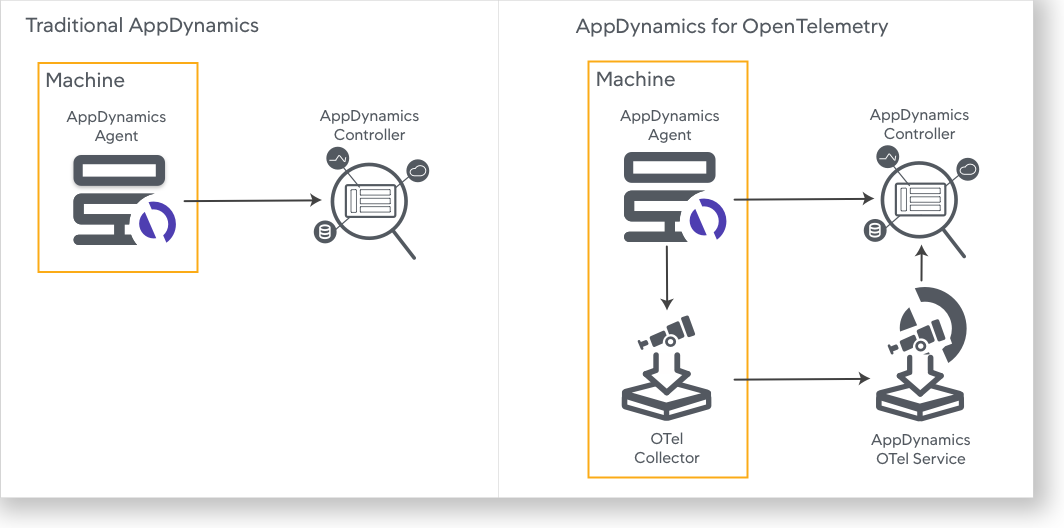
Splunk AppDynamics for OpenTelemetry
Learn how OpenTelemetry data is collected and sent to Splunk AppDynamics for application performance analysis.
OpenTelemetry is a collection of tools, APIs, and SDKs used to instrument, generate, collect, and export telemetry data (metrics, logs, and traces) to help you analyze software performance and behavior.
Splunk AppDynamics provides an OpenTelemetry-compatible backend to ingest OpenTelemetry trace data using OpenTelemetry components. The ingested data is processed by the Splunk AppDynamics backend and displayed in the Controller UI. This service is referred to as Splunk AppDynamics for OpenTelemetry.
Important: Starting with Virtual Appliance 26.7, the direct ingestion of OpenTelemetry data is no longer supported. You can ingest OpenTelemetry data using OpenTelemetry gateway only.