Use Baselines to Identify Trends
Performance expectations can differ between hours of the day, days of the week, or even months of the year. For example:
- A retail application may experience heavier traffic on the weekend than the rest of the week.
- A payroll application may experience a higher load at the beginning and end of the month compared to the rest of the month.
To account for this variation, you can use a rolling time period as the baseline context. A rolling time period establishes the baseline against data from the current hour taken at a daily, weekly, or monthly interval over the course of the time period.
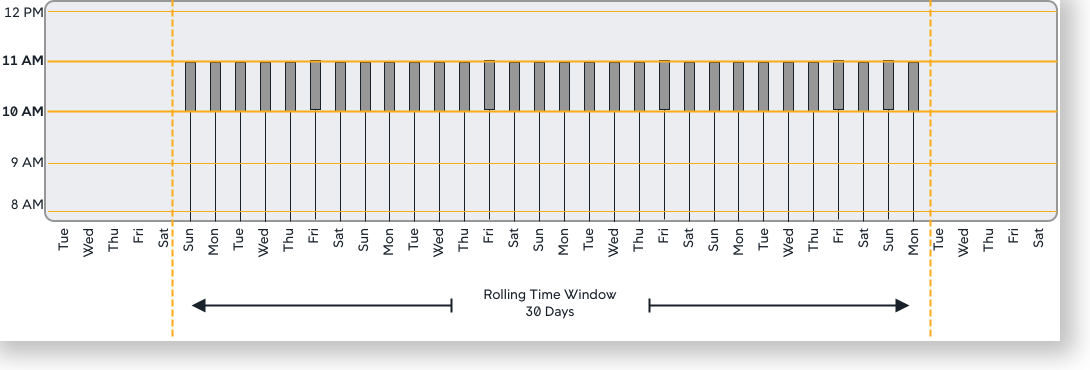
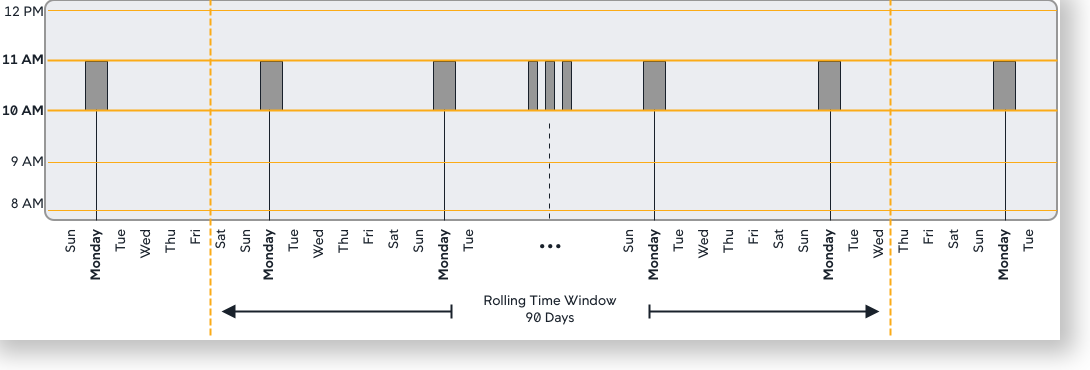
For example, you can have a baseline that uses a daily trend with a time period configured for 30 days or a weekly trend with a time period of 90 days.
A daily trend calculates the baseline from the data accumulated at the same time each day over the last 30 days.
A weekly trend calculates the baseline from the data accumulated on the same hour and day of the week over the last 90 days. This is one of the available default configurations.
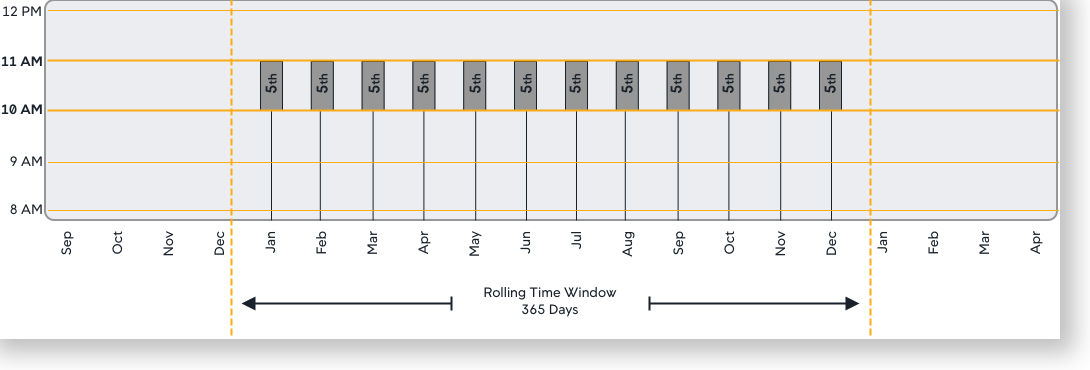
A monthly trend calculates the baseline from data accumulated at the same hour and same day of the month. So, for example, on January 5th at 10:30 AM, the baseline is established based on data accumulated at the same hour on the 5th of each month for the prior 365 days:
Baselines are not available immediately upon startup. It takes time and application load for the to collect data and create its initial baselines. The amount of time depends on the baseline type being used: daily, weekly, monthly, or none. Using none requires several hours before a baseline is available, daily takes several days, weekly takes several weeks, and so on.