Instrument Ruby Application Using OpenTelemetry
The following diagram demonstrates how OpenTelemetry1 data of a Ruby application is ingested into Splunk AppDynamics:
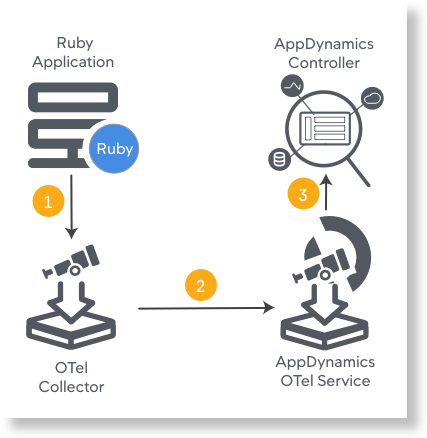
The Ruby application sends the OpenTelemetry spans to the OpenTelemetry Collector. The Collector then sends the spans to the Splunk AppDynamics OpenTelemetry Service via OTLP/HTTP(s). The Splunk AppDynamics OpenTelemetry Service consolidates the spans into traces and maps traces to Business Transactions that are registered with the Controller. The Controller UI displays the OpenTelemetry data from the Splunk AppDynamics OpenTelemetry Service.
1 OpenTelemetry™ is a trademark of The Linux Foundation®.