Instrument Applications with Splunk AppDynamics for OpenTelemetry
If you have an application that is monitored with Splunk AppDynamics Java, .NET, or Node.js Agents, you can instrument Splunk AppDynamics agents in your application to report both OpenTelemetry span data and Splunk AppDynamics SaaS data. When instrumented, the agents will generate OpenTelemetry span data from HTTP entry and exit requests. The Splunk AppDynamics correlation header is injected inside the OpenTelemetry baggage header, which results in the correlation with Business Transactions through intersecting OpenTelemetry nodes.
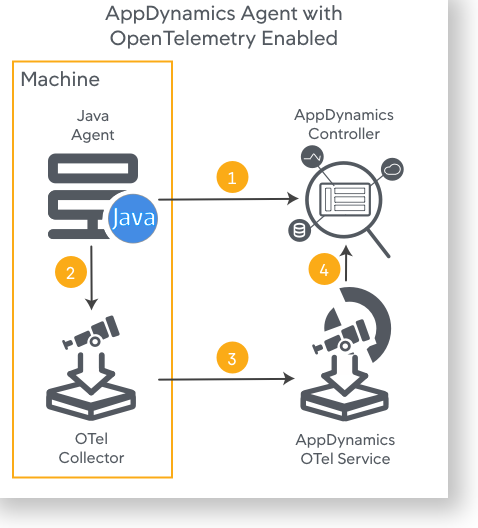
For example, the diagram above demonstrates how OpenTelemetry data is reported when an Splunk AppDynamics Java Agent is enabled for OpenTelemetry. The Java Agent sends Splunk AppDynamics SaaS data to the Controller and OpenTelemetry spans to the OpenTelemetry Collector. The Collector then sends the received spans to the Splunk AppDynamics OpenTelemetry Service via OTLP/HTTP(s). The Splunk AppDynamics OpenTelemetry Service consolidates the spans into traces and maps traces to Business Transactions that are registered with the Controller. The Controller UI displays both the Splunk AppDynamics SaaS data from the Agent and the OpenTelemetry data from the Splunk AppDynamics OpenTelemetry Service.